"Which statistics drive an increase in YouTube channel subscribers?"
Those who run YouTube channels have probably thought about this at some point.
Out of the blue, I've compiled the access analytics data for my YouTube channel over the past year and tried to figure out "which metrics are most likely to influence channel subscription counts."
I'm more of a humanities person, but I do enjoy this kind of small-scale analysis.
My channel, while modest, has just crossed the 2,000-subscriber mark.
I hope it can be a reference for budding YouTubers.
If you're interested in guitar, please check out the channel, and if you're inclined, I'd be delighted if you subscribed.
目次
Conclusion: The Most Influential Factor is "Watch Time"
I conducted a preliminary investigation by extracting various potential factors such as "views" and "impressions" to determine what has the most significant influence on YouTube channel subscribers.
The conclusion was that "watch time" has the strongest correlation.

Please focus on the upper-right section labeled "correlation coefficient."
A higher value of this number implies a greater impact on the number of channel subscribers.

For those wondering, "What is a 'correlation coefficient'?"
For now, remember that a higher value means that the other variable is more likely to be influenced.
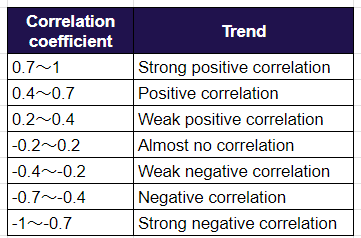
As a reference, here's a general idea of what the correlation means:

In this case, the correlation value is approximately 0.36, indicating a "slight positive correlation."
To be honest, even I thought, "View and impression counts must be more important," until I saw these results.
However, watch time had a much greater impact than I expected.
Despite the impression that channels with higher visibility tend to grow faster, it seems that high watch time is crucial.
It makes sense when you think about it.
People who spend more time watching videos are more likely to subscribe.
Many argue that releasing a large number of low-quality videos won't yield meaningful results, and this result aligns with that perspective.
Additional Information: Functions and Sheets Used
I performed this analysis using a function known as "CORREL," which is commonly referred to as "predictive analysis."
For those who are not familiar, it might sound a bit daunting at first.
However, it's a basic function included in both Google Spreadsheets and Excel, and once you understand it, it's quite simple.
You can use it with "=CORREL(range A, range B)."
The number of rows or columns in ranges A and B should match.
Here's an example:
`=CORREL(B3:B367, F3:F367)`
I'm a little embarrassed to share this, but it's nothing to be concerned about, so I'll provide a link to the spreadsheet.
https://docs.google.com/spreadsheets/d/15w6qbnyRTTdMFkR5oN6uGJz0Sg6s31Y8yk45wCZdLQw/edit?usp=sharing
Afterword
This analysis is, of course, specific to the trends on my channel.
It's possible that your situation might be different.
However, it's frequently heard that "channels with higher revenue have longer watch times."
So, aiming to increase watch time is likely not in vain.
Thank you for reading to the end.


